
Understanding BEDTools `reldist`
I very often use BEDTools reldist to measure the co-occurrance of two lists of genomic features relative to the random expectation.
For instance, given the 2 BED files (a.bed and b.bed) in the data folder of this GitHub repo:
bedtools reldist -a data/a.bed -b data/b.bed
Will produce a file like this:
reldist	count	total	fraction
0.00	30	774	0.039
0.01	24	774	0.031
0.02	17	774	0.022
0.03	30	774	0.039
0.04	21	774	0.027
- reldist = 0.01-bins of the relative distance metric (i.e. expect 50 non-header rows in the output file)
- count = number of features in
a.bedin a given reldist bin - total = total number of features in
a.bed - fraction = count / total
And here is where things did not make sense a priori, as I knew a.bed contained 788 genomic features:
wc -l data/a.bed
Which did not match the 774 figure in the total column! Where did the 14 missing features go?
BEDtools works so nicely and is so widely used that assuming I was not understanding the behaviour of the reldist tool had higher priority than raising the idea of a bug, so I decided to dig a bit more into it.
By using reldist’s -detail option one can get the relative distance value for each interval in a.bed:
bedtools reldist -detail -a data/a.bed -b data/b.bed > data/a_reldist.bed
Effectively, relative distances were only generated for 774 of the 788 features in a.bed:
wc -l data/a_reldist.bed
So I could find those 14 missing features intersecting the original a.bed list with that containing the relative distance values:
bedtools intersect -wao -a data/a.bed -b data/a_reldist.bed
And this is how a calming pattern appeared! Each of the 14 missing features (denoted by missing values like . and -1 in the output of the command above) was at the end of the chromosome or followed by another missing feature. More clearly:
bedtools intersect -wao -a data/a.bed -b data/a_reldist.bed |grep -C 1 -P '\.\t'
The cartoon below illustrates what is happening:
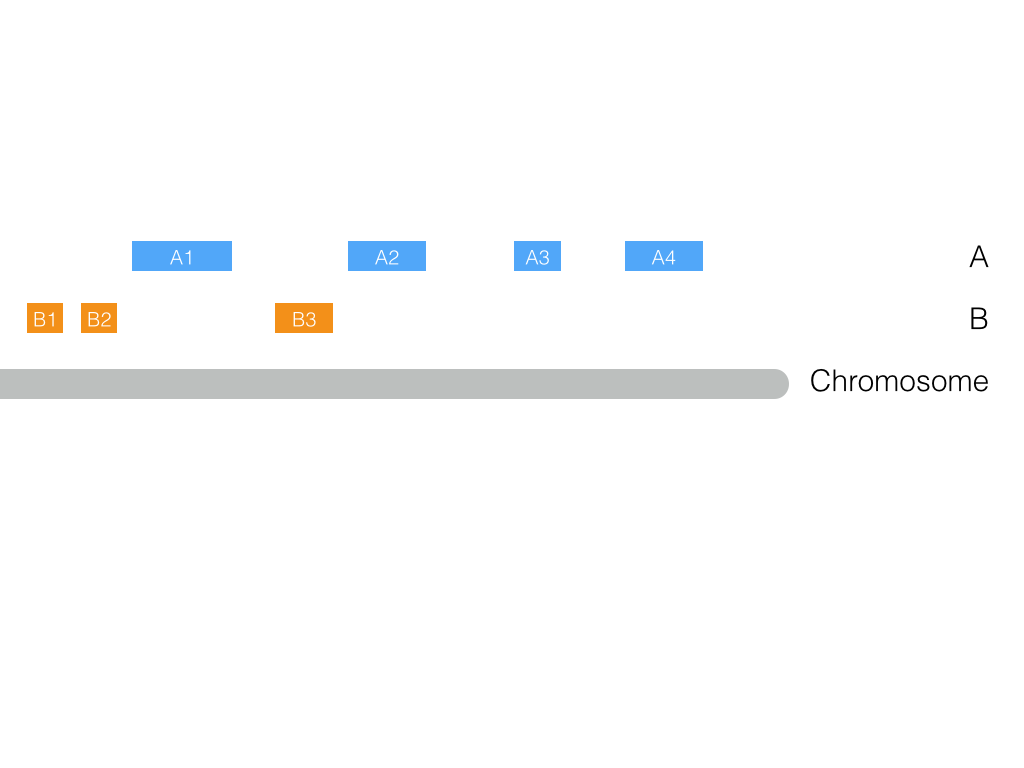
Using A1 as an example, the relative distance metric is calculated as the minimum distance between A1 and the closest B feature (i) upstream and (ii) downstream, that is, B2 and B3, respectively, divided by the distance between B2 and B3. It seems clear now that such a metric cannot be calculated by definition for features A2, A3 and A4 as there are not more B features downstream. Nonetheless, the fraction of features in a.bed with missing relative distance values is very small anyway (14/788 or <2%).