
List of things that made my work much easier
[Last update: 2017-07-05]
This is meant to be a frequently updated and never-ending list of tools/sites that have made my work analysing data much easier.
#5. Mount remote filesystems
All the data I work with is stored in a remote computing cluster and I perform much of the initial analysis there (especially that requiring a lot of computing memory and time). However, I do much of the downstream analysis with Jupyter notebooks running on my local machine, as Jupyter notebooks cannot be launched from my computing cluster. Therefore, accessing to the data on the cluster from my local machine is key, and I (Mac OS) do it with SSHFS as follows:
# 1. Create directory in your filesystem (target) that will map to the remote filesystem (source)
mkdir /target/directory

# 2. mount remote directory
sshfs cluster_user@cluster_address:/source/directory /target/directory
#4. Slack
Slack may resemble just as Gmail chat, Skype and/or Dropbox, but it is just more. Try it!
#3. GitHub flavored markdown
When embedding code in a Markdonw cell of an Ipython notebooks with the default syntax, it looked like pretty much as plain text; the only difference with the non-code text being the font type. This gets muchbetter when using the GitHub flavored markdown, which highlights your code as done in GitHub or as in many programming-oriented text editors.
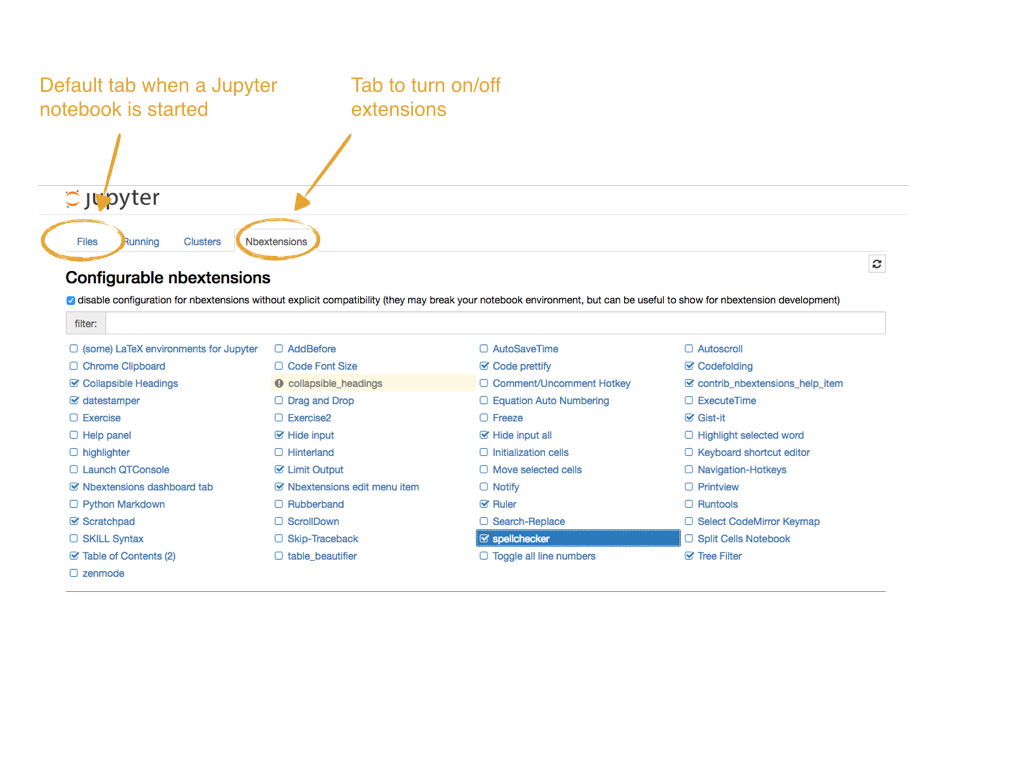
#2. Jupyter notebook extensions
Jupyter notebook extensions add very useful functionalities to your Jupyter notebooks. Installation is very straightforward and so it is turning them on/off.
#1. HTML-converted Ipython notebooks without code
One of the things I really like about using Ipython notebooks (now Jupyter notebooks) is that as you perform the analyses –if these are well documented– you are simultaneously generating a ready-to-send report. Especially if combined with nbconvert, which allows you to convert from the Jupyter notebook format (*.ipynb) to formats (e.g. *.html, *.pdf) which can be opened without having Ipython installed; the final report is even nicer if one uses the --to slides option. My satisfaction was incomplete because most of the users to whom I typically send the reports do not care about the code used to generate the results (i.e. plots, tables, statistics) and, therefore, the code cells really interfered the reading. Luckily I found this solution from Hannes Bretschnieder.